Recent national surveys reveal a steep decline in public support for the executive branch as economic pressures and foreign conflict intensify. You need to understand how these shifting approval metrics influence policy battles and reshape congressional power.
Multiple nonpartisan aggregators place President Trump’s approval rating below forty percent as the nation approaches the midterm elections. These historically low figures highlight widespread voter dissatisfaction across several key demographic groups.
This analysis explores the latest data, breaks down the driving policy forces, and gives you actionable insight into what these numbers mean for governance.
National Polling Averages: Where Public Opinion Stands
When you evaluate executive performance, looking at aggregate data provides a clearer picture than relying on any single poll. Aggregators smooth out temporary statistical noise by combining surveys that use varying methodologies and sample designs.
The latest polling averages from mid-October 2026 show public approval for the administration reaching its lowest levels of the current term. Widespread net-negative ratings indicate that voter frustration has become broad and sustained across the country.
The Aggregate Benchmarks
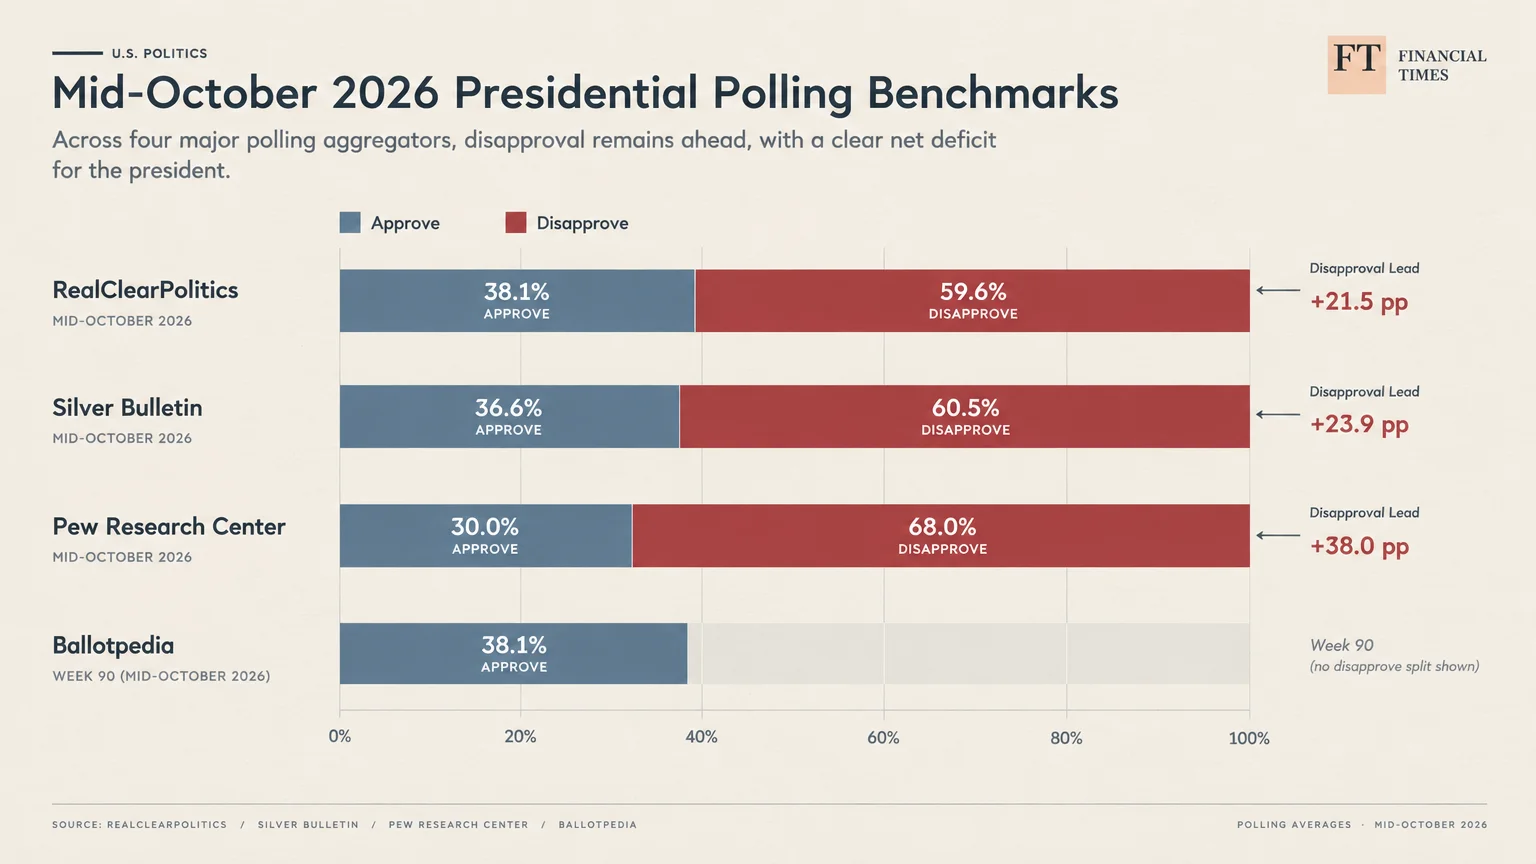
As of October 12, 2026, the RealClearPolitics polling average places Trump’s job approval at 38.1%, while 59.6% disapprove. This leaves the president with a net approval deficit of 21.5 percentage points.
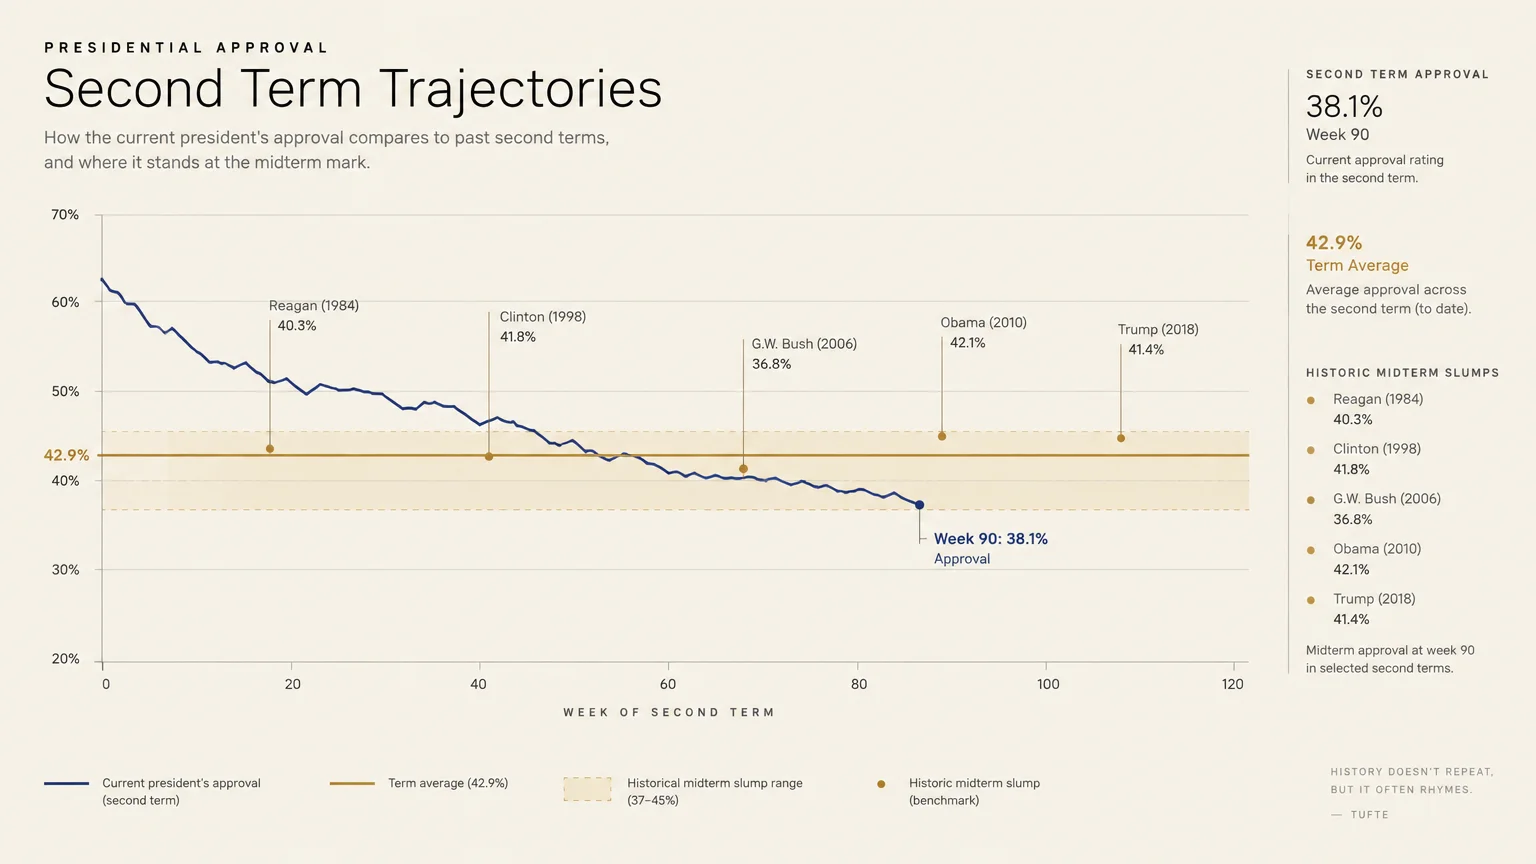
Data compiled by the Ballotpedia Polling Index confirms this downward trend across the administration’s second term. As of October 13, 2026, representing the 90th week of his presidency, Ballotpedia tracks his approval average at exactly 38.1%.
His term-wide average to date stands at 42.9%, illustrating that recent weeks have pulled his cumulative standing downward. You can see how steady drops throughout 2026 have eroded the goodwill present at the start of the term.
The Silver Bulletin aggregate, published by Nate Silver, recorded 36.6% approval and 60.5% disapproval on October 9 and 10, 2026. That calculation yields an underwater net rating of negative 23.9 percentage points.
The FiftyPlusOne aggregate offers an even starker assessment as of October 12, 2026. Its quality- and recency-weighted model registers total disapproval at 62.0%, leaving the White House with a net rating of Disapprove +27.
Divergence Across Major Pollsters
Individual nonpartisan surveys conducted in early October confirm the severe drop across different polling models. A major survey released on October 8, 2026, by the Pew Research Center measured approval at a second-term low of 30%.
In that Pew poll of 5,062 U.S. adults, conducted from September 28 through October 4, 68% of respondents voiced disapproval. This standing rests just one percentage point above his all-time Pew low of 29%, recorded in January 2021.
A national survey from Reuters/Ipsos released on October 5, 2026, matched this downward trend by placing Trump’s approval at 32%. That figure tied his previous second-term low, which the poll first recorded in late September.
A survey released on October 4, 2026, by CBS News/YouGov offered slightly higher numbers while remaining deeply underwater. In that poll of 2,166 adults, conducted from September 30 through October 2, 39% approved and 61% disapproved.
The CBS News/YouGov survey carried a margin of error of plus or minus 2.5 percentage points. This consistent deficit across multiple survey designs confirms that the administration faces a challenging public opinion environment.
The Policy Drivers Behind the Numbers
Approval ratings rarely drop without concrete policy triggers. When you look beneath the topline figures, specific policy decisions and economic conditions explain why public sentiment has soured so rapidly.
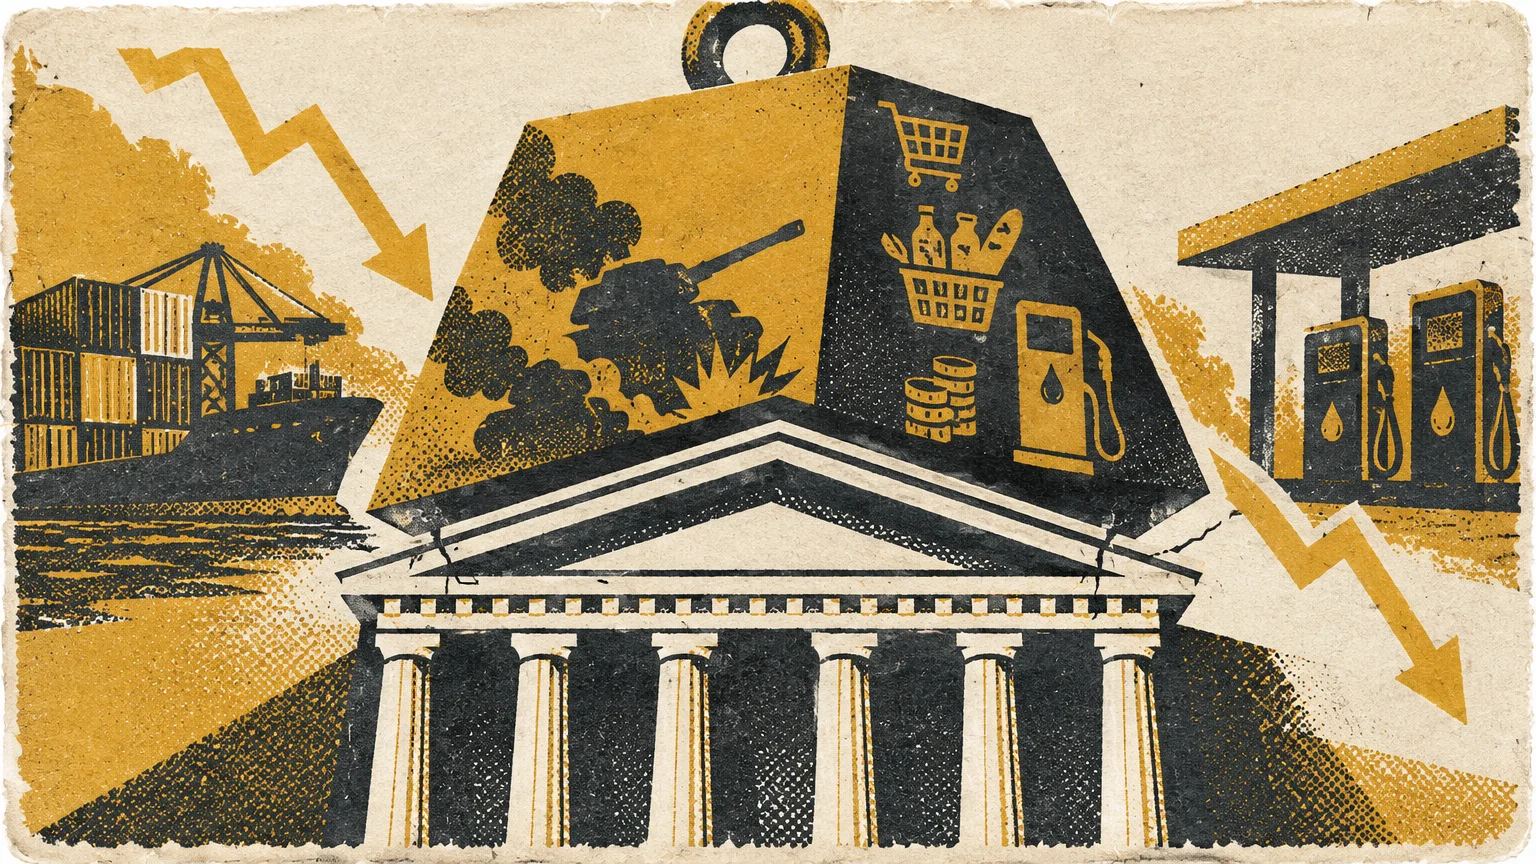
Voters consistently cite escalating pocketbook expenses and international turmoil as their primary concerns. Examining these issues clarifies the connection between executive actions and public dissatisfaction.
Inflation, Tariffs, and the Cost of Living
Everyday financial security remains the dominant factor shaping voter sentiment. An early October survey by the AP-NORC Center for Public Affairs Research reveals severe discontent regarding the White House’s economic management.
Conducted from September 24 through September 28 and released October 1, 2026, the AP-NORC poll found that only 26% of adults approve of Trump’s economic stewardship. Even fewer respondents—a meager 17%—approve of his handling of the cost of living.
These economic evaluations carry decisive political weight ahead of the November elections. In the October 5 Reuters/Ipsos poll, 52% of registered voters identified the cost of living as their most important midterm issue.
Executive trade policies have directly fueled these cost-of-living concerns. When the administration implemented aggressive universal tariffs, importers passed higher customs duties directly to wholesale distributors and retail customers.
You experience these economic policies every time you pay for groceries, household appliances, and imported building materials. The disconnect between White House assurances and grocery receipts has weakened consumer confidence across the nation.
Foreign Policy and the Iran Conflict
Foreign military engagements represent another major driver of declining public support. The ongoing Iran war has sparked widespread public exhaustion and raised concerns about prolonged international conflict.
Voters who supported an “America First” diplomatic platform have expressed frustration over deep involvement in overseas hostilities. Troop deployments, defense expenditures, and regional instability have amplified domestic anxiety.
The conflict has also driven up global energy prices, reinforcing the inflationary pressures that hurt household budgets. When foreign policy disruptions drive up gasoline prices, executive approval ratings almost always decline.
The administration now faces criticism from two distinct political factions. Anti-interventionist voters view the war as a breach of previous campaign promises, while moderate voters worry about broader military escalation.
Trade Policy Mechanics and Domestic Supply Chains
Tariff mechanics have created operational friction throughout domestic supply chains. Businesses must navigate unpredictable retaliatory tariffs imposed by foreign trade partners on American goods.
Export-dependent sectors, especially agriculture and high-tech manufacturing, have experienced reduced sales abroad. These operational headwinds force businesses to slow hiring and reduce capital investments.
You can see how trade barriers create conflicting incentives across the economy. While specific protected industries gain short-term insulation, the broader commercial sector absorbs higher operational overhead.
This dynamic has weakened the argument that protectionist trade measures create universal domestic prosperity. As supply chain disruptions persist, public skepticism toward the administration’s trade framework continues to grow.

Erosion of the Electoral Coalition
A president’s political durability depends on the stability of their core voting coalition. When an administration loses support from its base, its ability to govern effectively suffers a severe blow.
Recent survey data highlights significant defections within groups that secured the White House in the 2024 election. Examining these demographic shifts reveals how fragile the current political coalition has become.
Cracks Within the 2024 Base
The most alarming development for the White House is the rapid erosion among its loyal voters. Pew Research Center’s October 8, 2026, study reveals a steady, progressive slide within Trump’s core constituency.
Among voters who cast their ballots for Trump in 2024, only 67% currently approve of his job performance. This marks a sharp decline from the 75% approval recorded in July 2026.
The drop is even more striking when you look further back in his second term. His approval among 2024 supporters stood at 83% in early 2026 and reached 95% when he took office in early 2025.
Losing nearly thirty percentage points of base support over twenty months severely undermines executive authority. Meanwhile, among citizens who did not vote in 2024, his approval sits at just 24%.
When base voters express disappointment, volunteer enthusiasm wanes and small-dollar campaign donations drop. This grassroots exhaustion poses an immediate threat to the governing party’s legislative agenda.
Shifts Among Hispanic Voters
The administration made historic inroads with Latino voters during the 2024 campaign. However, recent polling demonstrates that those gains have largely disappeared under current economic and social pressures.
An NBC News and Telemundo survey released on October 4, 2026, revealed that only 24% of Hispanic Americans approve of Trump’s performance. This finding indicates widespread rejection of the administration’s recent policy decisions.
Furthermore, the same survey found that 59% of Latino voters favor a Democratic-controlled Congress. This preference highlights a decisive pivot toward the legislative opposition.
Working-class Hispanic families have felt the brunt of price increases on essential goods. Aggressive immigration enforcement policies have also created friction in many communities, driving voters away from the executive branch.
Warning Signs in Traditional Strongholds
Approval declines are no longer confined to swing states or suburban districts. Deeply conservative regions are registering notable levels of public dissatisfaction.
A Marist Poll of Texas conducted from October 8 through October 11, 2026, revealed that Trump is underwater in the Lone Star State. Among likely voters, only 46% approve of his performance, while 54% disapprove.
When a Republican president loses majority approval in Texas, down-ballot vulnerability increases everywhere. Conservative candidates in competitive districts must decide whether to embrace the White House or distance themselves.
This dynamic complicates party discipline in the House of Representatives and the Senate. Vulnerable incumbents frequently break with the executive branch when local polling turns negative.
Ethics, Governance, and Transparency Concerns
Beyond economic and foreign policy challenges, governance issues continue to depress public approval. Ethical considerations and conflict-of-interest allegations have eroded public trust in executive decision-making.
Survey data indicates that transparency concerns are no longer partisan talking points. A broad cross-section of the electorate now expresses unease regarding executive ethics.
Public Scrutiny of Executive Conflicts of Interest
A national poll released by AP-NORC on October 13, 2026, uncovered deep skepticism regarding the president’s business interests. More than half of U.S. adults believe Trump prioritizes his personal financial affairs over the country’s welfare.
Significantly, 55% of Republican respondents agreed that the president has prioritized his personal business interests. This internal party skepticism represents an extraordinary governance challenge for the White House.
The poll also showed that just 11% of Americans believe the president represents regular citizens. These findings suggest that the populist brand that propelled his political ascent has suffered immense reputational damage.
Pew Research Center’s October 8 study reinforces this transparency deficit. The study found that 69% of Americans possess little to no confidence that Trump separates his commercial holdings from presidential duties.
When voters conclude that federal policies benefit executive financial interests, policy legitimacy evaporates. This perception makes it much harder for the White House to build public support for controversial executive actions.
Institutional Oversight and Transparency Gaps
These public concerns have intensified clashes between the executive branch and federal oversight bodies. Independent watchdogs, such as agency inspectors general and the Government Accountability Office, monitor potential conflicts of interest.
When executive agencies resist information requests or delay mandated reports, public skepticism naturally increases. Legislative committees often launch public hearings to examine federal procurement and ethics compliance.
You can follow these developments by reading primary oversight reports published directly on federal agency websites. Reviewing official government filings helps you separate substantive ethical violations from routine partisan rhetoric.
Transparency disputes consume valuable executive time and distract from major policy priorities. An administration bogged down by ethics inquiries invariably struggles to sustain legislative momentum on Capitol Hill.
Historical Precedents: Second Terms and Midterm Dynamics
Evaluating approval ratings requires historical context. Understanding how past administrations handled political headwinds helps you anticipate what might happen in the coming legislative session.
Midterm elections traditionally serve as a referendum on the sitting president. When approval ratings remain deeply underwater, the governing party faces historical disadvantages.
Comparing Historical Trajectories at Week Ninety
Tracking approval over time provides valuable insight into second-term political dynamics. When Trump assumed office for his second term in January 2025, he began with an approval rating of 47%.
According to Ballotpedia, at the 90-week mark of his current term, his approval stands at 38.1%. That reflects a drop of nearly nine percentage points from his inauguration.
By comparison, at the 90th week of his first term, Trump maintained a higher approval average of 43.5%. His overall first-term average settled at 41.2%, which is higher than his current numbers.
Former President Joe Biden stood at 43.0% approval at the exact same 90-week milestone in his presidency. This comparison shows that Trump’s current standing is historically low compared to recent administrations.
Second-term presidents often experience what political analysts call the “second-term slump.” Without the prospect of another presidential reelection campaign, voter scrutiny intensifies while legislative leverage steadily declines.
The Midterm Legislative Penalty
Low approval ratings carry direct consequences for the balance of power in Washington. Presidents who poll below fifty percent going into a midterm election historically lose significant numbers of congressional seats.
When approval drops below forty percent, those losses typically expand into wave elections that flip chamber control. The generic congressional ballot provides an early indicator of this potential outcome.
In the October 5 Reuters/Ipsos survey, 44% of registered voters stated they intended to support Democratic congressional candidates. Only 37% planned to vote for Republican candidates, handing the opposition a clear advantage.
If the opposition party secures majorities in Congress, executive power changes dramatically. A hostile legislative majority can block presidential appointments, halt legislative priorities, and initiate aggressive committee investigations.
For you as a voter, a divided government means policy gridlock becomes the norm. The White House must either compromise on mandatory spending bills or rely on executive orders that face judicial scrutiny.
Changes in the Polling Landscape
The science of measuring public opinion has undergone significant restructuring in recent years. To interpret polling accurately, you need to understand how the industry has changed.
Major historical brands have shifted their focus, requiring analysts and citizens to consult different data sources. Recognizing these shifts ensures that you base your civic decisions on reliable information.
Navigating the Disappearance of Legacy Polls
The polling ecosystem experienced a major change when prominent aggregator FiveThirtyEight was disbanded prior to the 2026 cycle. For years, civic observers relied heavily on its weighted models to interpret political trends.
Additionally, Gallup announced in 2026 that it would cease conducting its regular presidential approval rating polls. Gallup had measured presidential popularity continuously since the administration of Harry Truman.
These departures have shifted attention to other aggregators like RealClearPolitics, Silver Bulletin, Decision Desk HQ, Ballotpedia, and FiftyPlusOne. Each platform uses distinct mathematical models to aggregate public surveys.
Some aggregators weigh polls based on past methodology and sample accuracy. Others apply strict recency filters to capture rapid changes in public opinion.
How You Can Accurately Evaluate Polling Data
When you encounter a new approval poll, check whether it surveys all adults, registered voters, or likely voters. Polls of all adults capture broad national sentiment, while likely voter polls offer better election predictions.
Always inspect the margin of error and the survey’s sample size before drawing firm conclusions. A survey with a large sample, such as the Pew poll of 5,062 adults, carries greater statistical reliability.
Be cautious of extreme outliers that diverge wildly from the established polling consensus. Consistent aggregate averages almost always provide a more reliable guide than an isolated survey.
By monitoring reputable aggregators, you can identify authentic shifts in national opinion. This analytical habit prevents you from being misled by partisan commentary and sensational headlines.
Frequently Asked Questions About Presidential Polling
Can an administration recover from net-negative approval ratings before a midterm election?
Significant polling recoveries in the final weeks before a midterm election are historically rare. Voter impressions of executive performance tend to solidify once major economic and foreign policies take effect.
A recovery generally requires an unexpected, dramatic event, such as an immediate resolution to an overseas conflict. Absent such shifts, low approval ratings typically translate directly into congressional losses on Election Day.
Why do different polling organizations show varying approval percentages?
Differences arise because pollsters use distinct survey modes, question wording, and demographic weighting formulas. Some organizations conduct online panels, while others rely on live telephone interviews or text messaging.
The CBS News/YouGov poll recorded 39% approval, while Pew Research found 30% during the same general timeframe. These variances demonstrate why looking at polling aggregates provides a more accurate view than reviewing single surveys.
How do foreign military conflicts influence executive approval over time?
Overseas military engagements occasionally generate a brief patriotic surge in approval during initial operations. However, prolonged military actions that involve substantial defense spending almost always erode public support.
The ongoing war with Iran exemplifies this historical pattern of public fatigue. Voters tend to penalize the administration as casualties occur, budgets expand, and regional instability spills into higher domestic energy prices.
What practical signals should you watch between national polls and local races?
National approval numbers reflect the overall mood of the country, but congressional elections occur in individual districts. You should examine whether local candidates invite the president to campaign with them or keep their distance.
When candidates decline joint appearances or run advertisements highlighting their independence, internal campaign polling likely mirrors negative national trends. Observing local candidate messaging shows you how presidential standing affects individual races.
Navigating the Upcoming Election Calendar
The practical implications of these poll numbers will culminate on the ballot. As a voter, you hold the power to shape the legislative landscape that will govern the remainder of this presidential term.
Understanding upcoming deadlines ensures your voice is heard. Tracking these civic milestones allows you to participate meaningfully in the democratic process.
Critical Deadlines and Governance Realities
The United States will hold its nationwide midterm elections on Tuesday, November 3, 2026. Every seat in the House of Representatives and one-third of the Senate will appear on the ballot.
You should verify your voter registration status immediately through your local election supervisor or state secretary of state portal. Many states set registration cutoffs thirty days prior to Election Day.
If you plan to vote by mail, confirm your jurisdiction’s application deadlines and submission requirements. Pay close attention to drop-box locations and required postage to ensure your ballot is counted.
Early in-person voting schedules vary significantly across different states and counties. Reviewing your local options early allows you to plan around personal schedules and avoid polling place delays.
Practical Steps for Civically Engaged Citizens
Look beyond executive approval numbers and research the candidates running in your district. Check their legislative voting records, public policy statements, and proposed solutions to economic issues.
Review candidate debates and public town halls to see how contenders address the cost of living and foreign policy. Evaluating direct statements helps you determine which candidate best aligns with your practical priorities.
After the election, continue to monitor how newly elected officials conduct oversight and cast key votes. Staying engaged between elections ensures that federal leaders remain accountable to the communities they represent.
Civic participation extends far beyond tracking weekly poll numbers. By voting, communicating with representatives, and demanding government transparency, you help preserve the integrity of our constitutional system.