Your Thanksgiving dinner table has become the sharpest economic battleground in American politics this November. Whether your household budget expands or contracts depends on how major supermarket chains manage wholesale volatility and how federal regulators police agricultural supply chains.
As families prepare for Thursday, November 26, 2026, grocery price metrics present two contrasting economic realities. Washington lawmakers now weaponize these holiday grocery receipts to influence national economic debates, farm legislation, and upcoming federal regulatory agendas.
Understanding these holiday food costs requires looking beneath store promotions to analyze the agricultural policy decisions, retail consolidation, and trade forces that shape your receipt. Here is how policy choices directly influence your holiday dinner costs this year.
Capitol Hill and the Thanksgiving Receipt: The Political Flashpoint
Every November, the dinner table becomes an unavoidable political referendum for incumbent lawmakers and agency heads. Politicians routinely deploy turkey prices to validate their economic policies or attack their opponents’ regulatory priorities.
Congressional leadership regularly highlights seasonal grocery staples during floor speeches and television appearances. These speeches frame standard holiday grocery runs as direct evidence of federal administrative success or legislative failure.
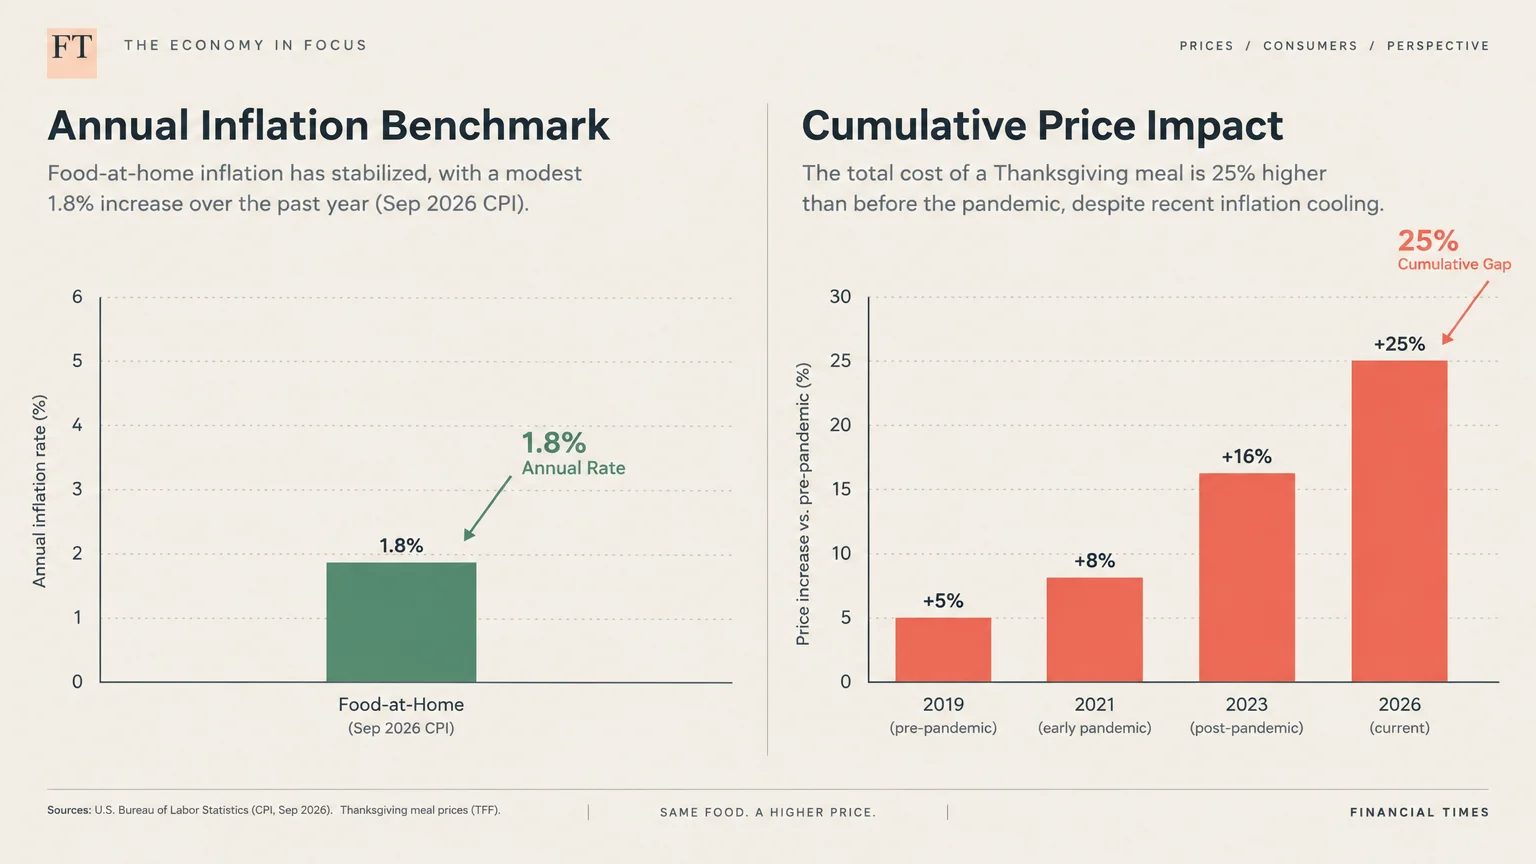
The latest inflation figures provide ample ammunition for competing economic talking points. According to the Bureau of Labor Statistics Consumer Price Index, food-at-home prices rose 1.8% over the twelve months ending in September 2026.
Administration allies champion this 1.8% annual grocery rate as proof that post-pandemic price shocks have settled into a predictable rhythm. They urge consumers to look at stabilizing annual benchmarks rather than past price turbulence.
Congressional critics counter by emphasizing the long-term cumulative price increases that families face each week. A standard Thanksgiving meal for ten people still costs roughly 25% more than it did before the pandemic inflationary surge.
This 25% cumulative gap shapes voter sentiment far more forcefully than modest twelve-month price declines. While annual rates may level off, the higher absolute cost base continues to strain household budgets across the country.
Federal committees overseeing commerce and agriculture continue to call corporate executives to testify about retail pricing practices. Lawmakers demand answers regarding why consumer relief lags behind the drop in energy and shipping costs.
These hearings rarely produce immediate statutory changes; instead, they serve as high-profile political theater designed to direct public frustration. The resulting headlines allow lawmakers to claim vigilance while avoiding the difficult task of overhauling complex supply-chain regulations.
Players and Strategy: Lobbyists, Retailers, and the Farm Coalition
Behind every grocery receipt lies a high-stakes lobbying battle involving food manufacturers, agricultural lobbies, and retail trade associations. These corporate coalitions spend millions each quarter to shape how federal agencies regulate food production.
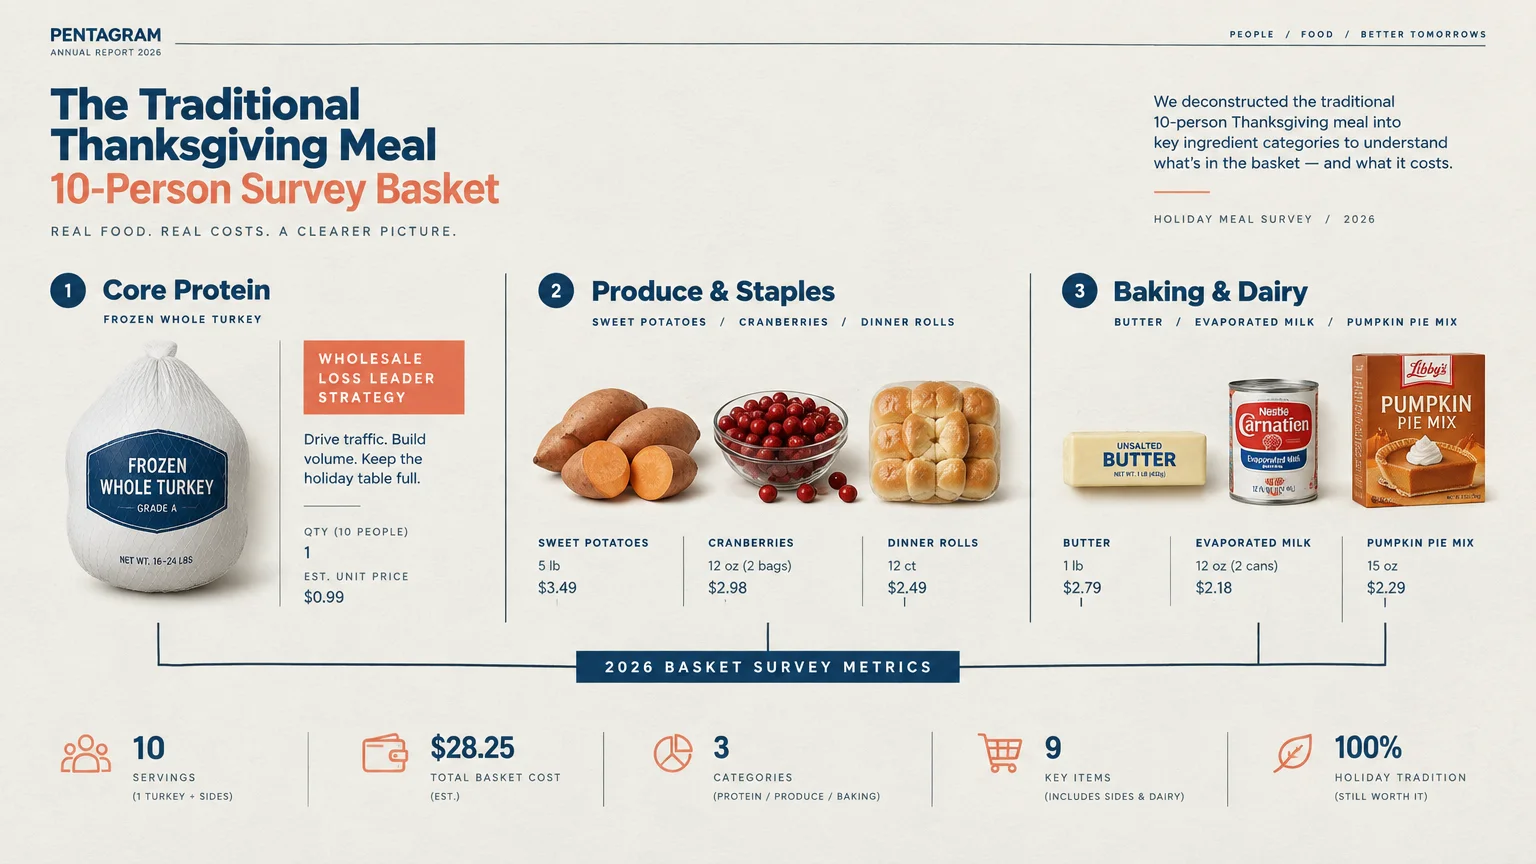
Supermarket chains execute calculated retail strategies to shield consumers from wholesale costs on visible staples. They frequently price frozen whole turkeys as loss leaders to draw you into their stores.
Retailers willingly absorb paper losses on whole birds because they anticipate you will purchase high-margin side items. They make up those margins on specialty ingredients, packaged seasonings, and convenience desserts.
National retail associations lobby aggressively against federal and state price-gouging proposals. They argue that government caps on grocery margins would disrupt complex distributor relationships and cause severe regional inventory shortages.
Agribusiness trade groups direct their financial capital toward members of the House and Senate Agriculture Committees. Political action committees representing livestock and grain producers prioritize maintaining flexible federal insurance programs and federal feed crop subsidies.
These farm lobbies often find themselves at odds with consumer advocacy groups that demand increased corporate transparency. Watchdog organizations argue that consolidated meatpackers and food processing conglomerates enjoy excessive power over pricing benchmarks.
Major grocery conglomerates counter that their net profit margins remain within narrow, traditional single-digit bands. They point to escalating logistics costs, store security investments, and elevated retail employee wages as primary price drivers.
Grassroots family-farm coalitions push back, contending that corporate processors capture the vast majority of consumer food spending. These producers argue that farm-gate revenues fail to keep pace with the rising retail prices on grocery shelves.
Decoding the 2026 Thanksgiving Basket Surveys
Conflicting survey methodologies can create confusion when you try to measure actual holiday price shifts. Different economic reports track distinct shopping lists, revealing starkly different grocery bills for identical gatherings.
The Wells Fargo Agri-Food Institute released its annual Thanksgiving report on November 9, 2026, offering detailed insights into holiday costs. Their research priced a classic ten-item dinner for ten people at $78.93, or $7.89 per person.
This $78.93 basket represents a modest 0.4% decline compared to 2025 holiday levels. The study demonstrates how slight drops in center-plate staples can offset persistent inflation across supporting ingredients.
When you expand that shopping basket to include alcoholic and non-alcoholic beverages, the financial picture shifts substantially. Adding wine, beer, and sparkling water increases the total celebration cost for ten people to $127.54.
That expanded beverage basket represents a 0.5% increase over 2025 totals. The beverage category alone accounts for $48.61 of the bill, reflecting a 2.0% year-over-year climb driven by packaging and ingredient expenses.
The American Farm Bureau Federation conducts a widely cited annual Thanksgiving cost survey that dates back to 1986. Their national benchmark provides a consistent historical baseline for comparing traditional holiday grocery expenditures.
In 2025, the Farm Bureau priced its classic dinner for ten at $55.18, or $5.52 per guest. That represented a 5% decline from 2024, marking three straight years of easing from the record peak of $64.05 in 2022.
While the national Farm Bureau survey appears shortly before the holiday, state-level affiliates track local retail variations earlier. On November 12, 2026, the Retail Association of Nevada projected their regional meal cost at $57.72, a 4.6% increase over 2025.
Alternative tracking by Self Financial in November 2026 evaluated a larger, recipe-based menu that included items like sweet potato casserole and two pies. Their comprehensive basket totaled $137.93 for ten diners, reflecting a 17.3% drop from $166.69 in 2025.
Nearly 95% of Self Financial’s calculated savings stemmed from promotional turkey pricing, which fell 48.1% from $57.00 down to $29.60. Meanwhile, specialty items climbed; pecan pie rose 9.2% to $15.14, and salad greens climbed 2.9% to $4.48.
A separate October 2026 tracker from PwC estimated that a complete Thanksgiving dinner for ten costs approximately $90. That estimate rose from $88 in 2025, underscoring how varied methodology shapes the headline figures you read.
Policy Breakdown: Farm Bill Gridlock, Antitrust, and Trade
Statutory gridlock in Washington directly affects what farmers plant and what you ultimately pay at the supermarket. The ongoing delay in reauthorizing the federal Farm Bill leaves agricultural support programs running on temporary extensions.
The multi-year Farm Bill governs everything from commodity crop support and conservation programs to domestic nutritional assistance. Disagreements between congressional chambers over supplemental nutrition funding and commodity baseline spending have repeatedly stalled final passage.
Feed crop subsidies authorized through federal agricultural programs heavily influence livestock pricing across the United States. Federal support structures for domestic corn and soybean production directly determine input costs for commercial turkey growers.
Antitrust enforcement is another critical policy area influencing grocery costs. The Federal Trade Commission has taken an aggressive stance against proposed mega-mergers among national supermarket chains.
Regulators argue that extensive consolidation reduces regional retail competition, which allows corporate chains to widen margins and raise consumer prices. Retailers counter that scale allows them to negotiate lower wholesale pricing from multinational packaged-food conglomerates.
Federal packaging regulations and labor rules also factor heavily into your seasonal grocery receipt. Compliance mandates across regional freight networks and processing facilities add recurring administrative expenses that food companies pass directly to consumers.
Trade policies and retaliatory agricultural tariffs also introduce volatility into domestic meat supplies. When international export demand for domestic poultry shifts due to trade disputes, meatpackers adjust domestic inventories and wholesale pricing accordingly.
These policy levers rarely work overnight; instead, they exert steady pressure on supply chains throughout the growing season. The cumulative effect of these administrative rules becomes apparent when holiday demand spikes every November.
The Turkey Supply Chain: Avian Flu, Feed, and Wholesale Spikes
The central item on your Thanksgiving table represents an intricate balance between flock biology and agricultural commodities. The turkey sector has spent the past year recovering from severe biological disruptions that sharply curtailed supply.
Avian influenza outbreaks caused an 8% drop in overall turkey production throughout 2025. Commercial producers had to depopulate infected facilities and navigate lengthy biosafety quarantines before rebuilding their flocks for 2026.
Data from the Texas A&M AgriLife Extension Service shows that domestic flocks have made substantial recovery gains this year. The total number of birds heading to commercial markets is up 3% in 2026, while total pounds produced rose nearly 6%.
This supply recovery helped stabilize the wholesale market, yet input costs have kept base production expenses elevated. Corn and soybean feed expenses rose between 10% and 12%, preventing wholesale prices from returning to pre-pandemic lows.
These feed costs pushed late October 2026 wholesale whole turkey prices to an average of $1.80 per pound. That represents a noticeable increase from the $1.69 per pound wholesale average recorded in October 2025.
A striking gap has emerged between wholesale poultry prices and unpromoted retail shelf prices. While wholesale prices climbed, competitive supermarket loss leaders kept promotional pricing low for organized holiday shoppers.
Texas A&M AgriLife Extension data revealed that the national unpromoted grocery price for frozen whole turkeys reached $1.26 per pound in early November 2026. This figure marks a 22% increase from the $1.03 per pound unpromoted average recorded twelve months earlier.
If you shop without store loyalty discounts or outside holiday promotional windows, you will encounter these higher unpromoted prices. This wide pricing spread illustrates how retail promotions can mask structural wholesale cost pressures.
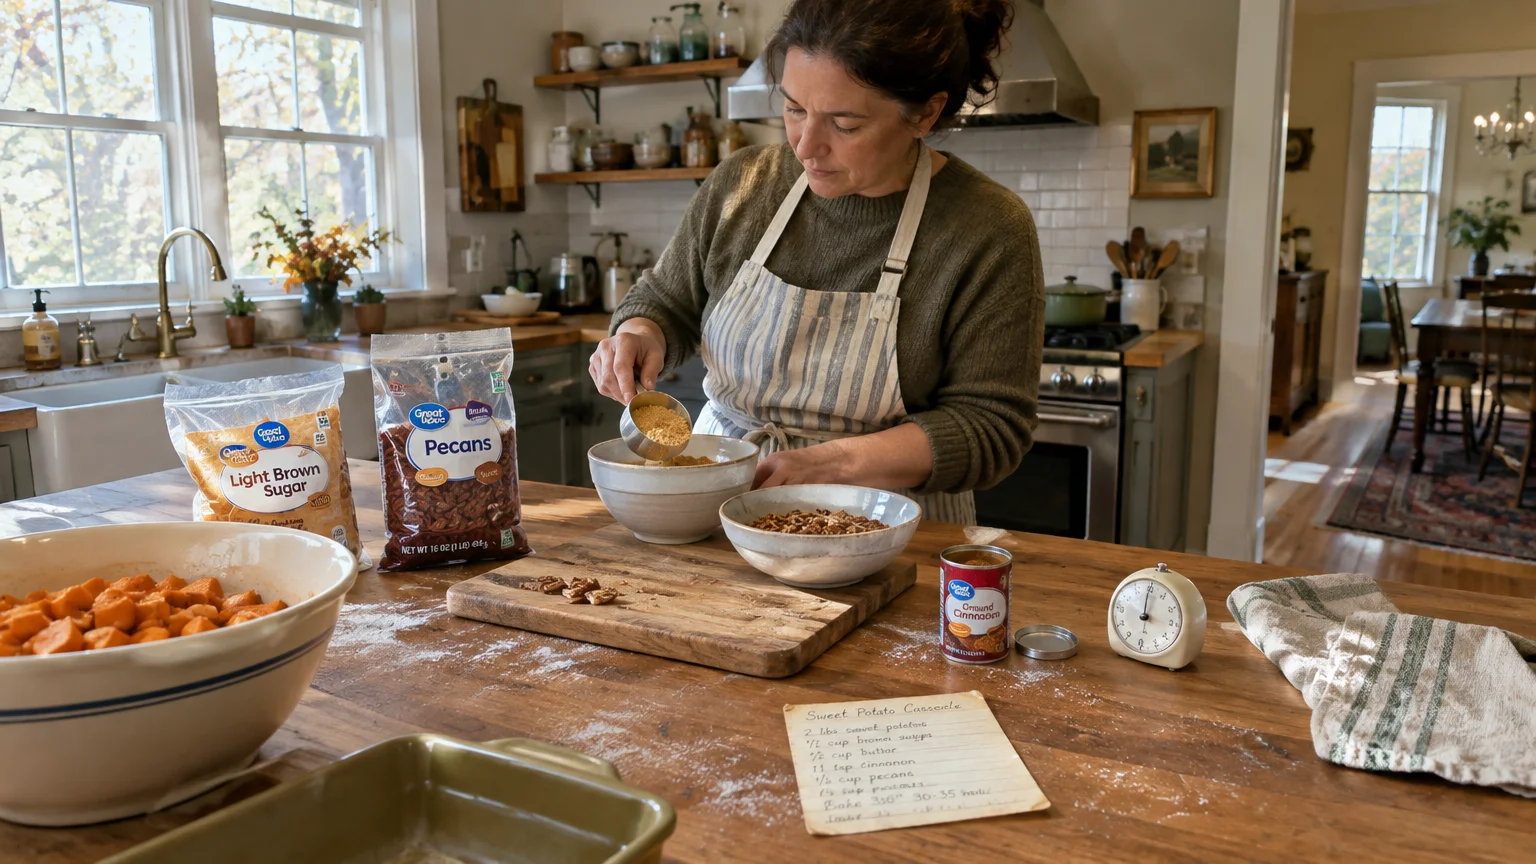
Side Dishes, Desserts, and Consumer Adaptations
While turkey grabs the economic headlines, side dishes and desserts drive the modern Thanksgiving grocery bill. Price movements across vegetable aisles and bakery shelves show diverse trends that reward careful menu planning.
The Wells Fargo Agri-Food Institute reported that six of ten classic Thanksgiving food items declined in price compared to 2025. Cranberries experienced the largest drop with a 6.6% decrease, while frozen vegetables fell 4.2% and turkey dipped 0.5%.
Shoppers will also find lower retail prices on prepared stuffing, dinner rolls, and whipped cream toppings. Prepackaged salad blends maintained flat pricing compared to the prior year, providing budget stability for fresh starters.
Conversely, traditional dessert items and specialty baking ingredients continue to climb across nationwide grocery chains. Pumpkin pie prices rose 2.5%, prepared gravy mixes climbed 2.2%, and fresh mashed potatoes saw a 1.3% retail increase.
These dessert price increases have encouraged noticeable shifts in shopping patterns. Consumers increasingly choose bulk purchases to lower their per-unit costs when buying holiday pies.
Shoppers buying 58-ounce pumpkin pies pay an average of $0.11 per ounce. In contrast, those buying smaller 22-ounce pies pay $0.26 per ounce, representing an immediate premium for smaller packaging.
Broader behavioral trends are also beginning to alter holiday grocery purchasing patterns. The Wells Fargo report noted that approximately one in eight American adults now uses GLP-1 weight-loss medications.
Widespread adoption of these medications is beginning to trim portion sizes and temper overall grocery volumes at family gatherings. Households are purchasing fewer excess side dishes, focusing instead on high-quality center-plate items and smaller dessert spreads.
Regional Disparities and Constituent Impact
Inflation does not affect all American households equally; your geographic location heavily dictates your holiday grocery expenses. Regional freight logistics, local labor costs, and state regulatory standards create substantial price divergences across state lines.
While national surveys indicate broad price stabilization, Western and Sun Belt markets frequently face steeper retail adjustments. Nevada’s projected 4.6% meal cost increase highlights the localized price pressures that aggregate national statistics can obscure.
Transportation expenses explain much of this regional pricing variation. Hauling fresh and frozen agricultural goods across interstate corridors adds fuel surcharges and freight tariffs that distributors pass along to regional grocers.
Rural communities face unique economic challenges despite their proximity to agricultural production hubs. Rural residents often rely on small independent grocers that lack the buying leverage necessary to offer loss-leader whole turkeys.
For low-income households, holiday grocery inflation poses an enduring financial challenge. Food expenditures represent a much larger share of household income for families living paycheck to paycheck.
Federal nutritional assistance programs have struggled to match the cumulative 25% grocery price increase logged over recent years. While annual cost-of-living adjustments help, recipients find that their monthly benefits buy fewer traditional holiday ingredients than in years past.
Nonprofit food banks and charitable feeding operations experience these pressures from two sides simultaneously. They face higher wholesale acquisition costs for holiday turkeys while seeing increased demand from working families seeking assistance.
These regional and economic disparities explain why national economic data often conflicts with local constituent sentiment. Macroeconomic reports of stabilizing inflation offer little comfort to families whose local grocery stores charge top-tier prices.
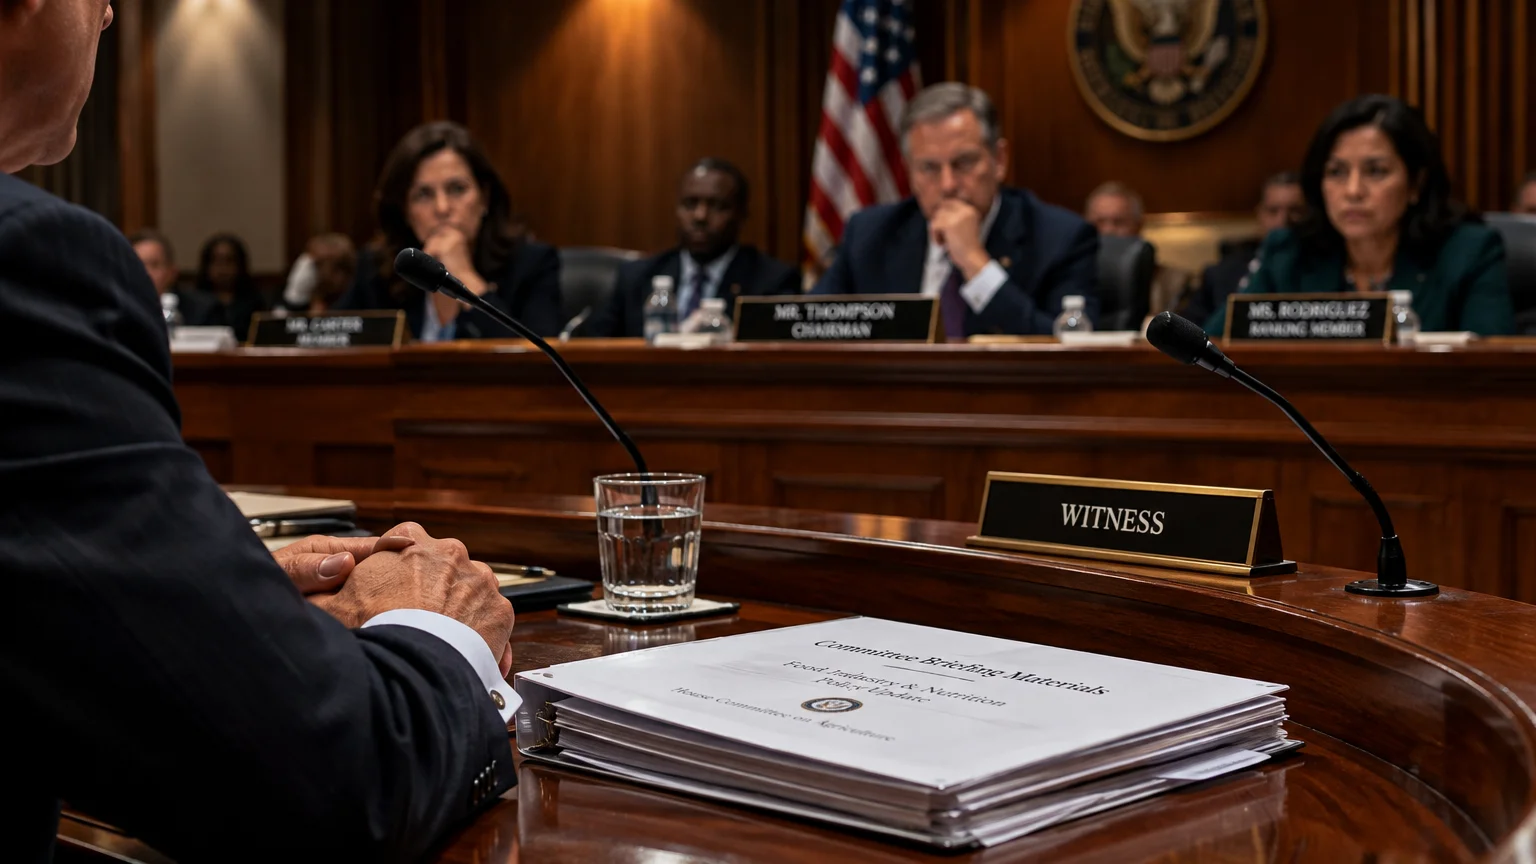
Oversight, Ethics, and Transparency Battles
Persistent consumer frustration over food costs has sparked heightened scrutiny from federal ethics monitors and state watchdogs. Public interest groups regularly question whether corporate margins or genuine commodity shocks drive elevated retail prices.
Watchdog groups have urged congressional oversight committees to investigate potential margin expansion within meatpacking and retail grocery sectors. They argue that dominant firms use general inflation coverage to raise prices beyond their actual input-cost increases.
Corporate trade representatives defend their accounting practices before federal regulators. They assert that increased expenses for store security, refrigeration compliance, and employee healthcare require sustainable retail markups across every aisle.
State Attorneys General have increasingly launched independent inquiries into dynamic pricing algorithms used by major retail chains. Regulators worry that automated pricing systems adjust staple costs during high-demand shopping weeks without transparent consumer disclosure.
Supermarkets maintain that algorithmic tools merely help managers optimize inventory and prevent localized supply shortages. They argue that automated systems reduce perishable food waste by discounting items approaching their expiration dates.
Campaign finance filings also show significant political contributions flowing from agribusiness executives to members of congressional oversight panels. Ethics watchdogs contend that these political donations discourage lawmakers from pursuing aggressive price-setting investigations.
Legislative transparency measures aimed at standardizing unit-pricing labels remain stalled in congressional subcommittees. Consumer advocates argue that uniform unit pricing would make it easier for holiday shoppers to spot stealth shrinkflation tactics.
These oversight battles ensure that food inflation will remain a central point of contention for federal regulators long after Thanksgiving passes. Scrutiny over supermarket operations is shifting from seasonal headlines into sustained regulatory and legal battles.
Frequently Asked Questions
Why do different Thanksgiving cost surveys report drastically different totals?
Survey totals vary because organizations track fundamentally different menus and shopping strategies. While some evaluate basic promotional baskets of ten items, others track complete scratch-cooking recipes that include premium side dishes and beverages.
Surveys that capture supermarket loss-leader turkey discounts report lower overall costs. In contrast, analyses that evaluate full retail shelf prices without promotional discounts reflect higher real-world expenses.
How can wholesale turkey prices rise while retail turkey appears cheaper?
Supermarkets frequently sell whole frozen turkeys below their wholesale acquisition costs to draw shoppers into stores. Retailers absorb these wholesale turkey losses because they expect customers will buy profitable side dishes, beverages, and desserts.
If you buy an unpromoted turkey or shop outside holiday sales windows, you absorb the full wholesale increase. The recent 22% increase in unpromoted retail turkey prices illustrates the true underlying wholesale pressure.
What legislative actions could alter grocery costs in the coming year?
The reauthorization of the federal Farm Bill represents the primary legislative vehicle affecting future agricultural production costs. Its commodity subsidy formulas and crop insurance provisions directly shape feed grain production and livestock breeding decisions.
Federal Trade Commission enforcement against retail grocery mergers will also shape regional supermarket competition. Additionally, state legislative measures targeting algorithmic pricing and supply-chain transparency could change how retailers price seasonal food staples.
How is consumer behavior fundamentally shifting holiday spending?
Shoppers are adopting defensive retail habits, such as buying bulk pies and store-brand side ingredients to avoid brand-name markups. Purchasing a 58-ounce pumpkin pie instead of smaller packages cuts per-ounce bakery costs by more than half.
Furthermore, the rising use of GLP-1 weight-loss medications among one in eight adults is subtly altering household meal planning. Families are preparing smaller side-dish volumes, which helps control overall holiday dinner expenses.
Outlook: The Legislative Calendar and Your Holiday Wallet
As you clear the Thanksgiving table, the political fight over grocery costs and agricultural spending will move directly into the winter legislative session. Lawmakers returning to Capitol Hill face immediate deadlines regarding the delayed Farm Bill reauthorization.
Congressional leadership must decide whether to pass another short-term Farm Bill extension or compromise on commodity support baselines and nutritional assistance funding. The outcome will set agricultural supply baselines for the next five years.
Federal antitrust litigation surrounding proposed supermarket mergers will also reach critical court decisions in early 2027. These judicial rulings will determine whether regional retail competition expands or concentrates further across major consumer markets.
Watch for state legislatures to introduce targeted bills addressing dynamic pricing and retail margin transparency as their sessions open in January. Several state attorneys general plan to issue formal reports on holiday grocery markups and supply-chain practices.
Your holiday grocery bill reflects a complex web of farm biology, corporate retail strategy, and federal policy decisions. Tracking these legislative developments helps you understand the economic forces shaping your family budget throughout the coming year.